
 Long-time readers know I’ve been commenting on gold a lot lately, specifically regarding gold’s comeback after that long drop that started in March 2013.
Ironically, in the face of unprecedented money printing by politicians everywhere, gold has been floundering for months. Gold has been testing the patience of even the most ardent ‘gold-bugs’, but that patience may soon be rewarded.
As I’ve often said, it’s not so much figuring out WHAT’s going to happen, but rather WHEN. And for that, dear reader, we let the market do the talking…
Below we see a 3-year chart of the proxy for gold, GLD. What is now apparent is something called an ‘inverse head and shoulders’ pattern, which is potentially bullish:
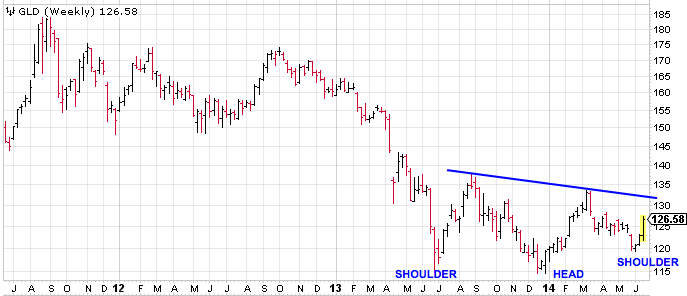
The blue line I drew there is the ‘neckline’ of the pattern- a line that joins the two peaks of it. To complete the pattern, GLD needs to break the $133 mark. If that happens, gold should be off to the races because the bigger the pattern, the more powerful its meaning is. And this is a pattern that’s formed for over a year!
What’s particularly encouraging about that pattern is that the right hand shoulder is higher than the head and the other shoulder; it seems to ‘want’ to go up.
And there’s more good news if we zoom into the chart of the last 6 months:
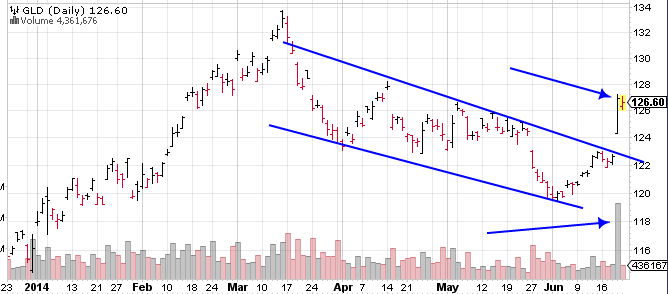
As you can see by the blue lines I drew, GLD just exploded out of that downwards channel that started in March. And it did so in style- the bottom arrow points to a spike in buying volume, meaning big institutional buying is going on- something we haven’t seen in a while. When you see action like that you should sit up and take note.
And when stars start aligning, it’s time to start raising cash in preparation.
Best
Jim.
The author has an interest in the securities discussed in this article. Source of charts: stockcharts.com
Note from editor: check your email to see if you received a limited time invitation to the Stock Code Breaker course.


