
 Well, I’m pleased to see markets pull back from the edge, especially the Nasdaq and Russell 2000 stock indexes, as I’d relayed my concerns to you a couple of weeks ago- both indexes made a surprise move back into ‘safe’ territory.
But does this silver cloud have a dark lining?
Let’s look at where we’re at now and what might happen next as this aging bull refuses to go down without a fight…
I must first say that the Midas Legacy market trend alerts on the website, both long term and short term were solid green throughout the doubting period. Maybe I should just watch those. And here’s the picture they were portraying…
This is the benchmark index, The S+P 500, which just last week broke out to brand new highs:
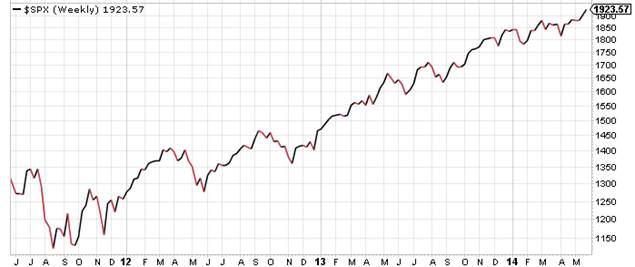
You can’t fault that chart- the S+P has been and still is locked in a firm uptrend, healthily correcting along the way for sure, but that’s fine. Betting against that chart right now is a bad move- it’s not rocket science to see a chart like this and say it’s a good one!
The smaller company indexes such as Nasdaq and Russell 2000 evidently decided to follow the S+P and return to their uptrend, although the recent damage done makes those two still look like the start of a topping out process:
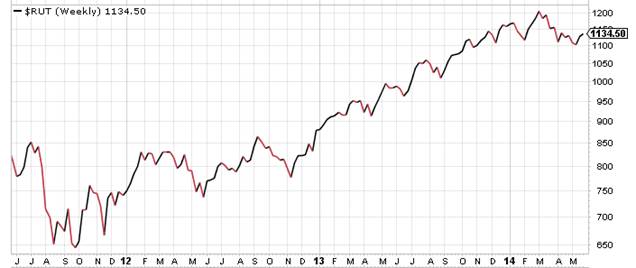
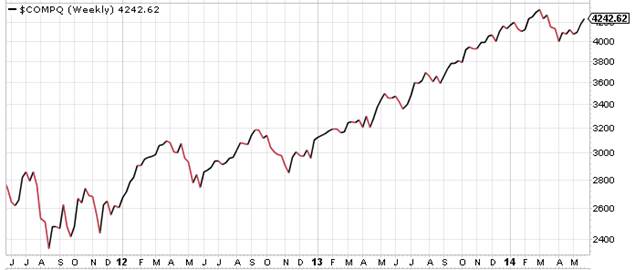
But topping out processes can take months and months before they turn into bear markets.
So what happens next, according to Mr. Market?
For now, he’s got his bull costume on, and we have to give this market the benefit of the doubt until he puts his bear costume on. I do think he’s got the bear costume out of storage though, ready for the first sign of unexpected trouble, so we must remain fast on our feet. I’m sticking to my current strategy of SWBS (Sell the Weak, Buy the Strong) so I’m hedging my bets with a mix of shorts and longs.
In the shorter term, this market is getting overbought and due for a correction, and that’s the dark lining on this silver cloud. The Volatility Index (VIX) is a measure of how complacent or fearful the market is- the higher the number the more fearful it is, and the lower the number the more complacent it is. Needless to say, the VIX constantly fluctuates between extremes of fear and complacency- going in the reverse direction to the market.
Here’s the 3 year chart of VIX (see how it spiked in that scare of summer 2011 and dropped in the big bull of 2013?):
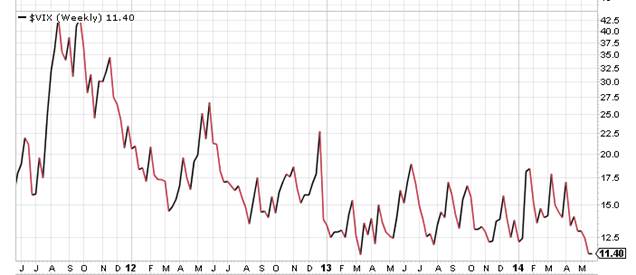
As you can clearly see, the VIX is at the lowest level it’s been in three years. What you can also clearly see is that it doesn’t stay that low for very long, and that tells me we’re due for a correction soon and the VIX will spike up again. How far it will do so is the question. Markets have only just got themselves back on track, so the imminent correction needs to be brief, healthy, and cause minimal damage.
Jim Samson.
Note from editor: check your email to see if you received a limited time invitation to Jim Samson’s Black Market Income


