
 Over the course of the last month or so, I have written about a number of topics—silver, the Russell 2000 and market neutral strategies. Over the course of the last three weeks, the S&P has gone through one of the roughest patches of the last few years culminating with the 3.14% loss last week.
Last week’s loss brought the S&P into the forefront as the index broke below the lower rail of the trend channel that has dictated the trading range for almost two years now.
This development in the chart is concerning and what makes it even more concerning is that it is happening at the very beginning of the new earnings season. This week we will get key earnings reports from companies such as Citigroup, Intel, Johnson & Johnson, JP Morgan, Wells Fargo, Bank of America, EBay, Goldman Sachs and GE. And this is just the beginning of the earnings season.
It could be that the index finds support at its 52-week moving average and then this three-week stretch becomes another blip on the long-term chart. Personally, I get the feeling that it is more than that. It seems like this could be the start of a more significant downswing, but I am not completely convinced just yet.
If we were to see a bearish crossover of the 13-week and 52-week moving averages, then I would become convinced. In the past 25 years or so, when we have had a bearish crossover of these moving averages, it has been a pretty good sign to get out of stocks or at least to move most of your money out of stocks. There have been a few false alarms, but had you moved out of stocks when the crossover came in late 2000 and again in 2007, you would have saved yourself from a lot of pain.
Looking at the Russell 2000 chart that I shared back a few weeks ago, we see that the downtrend has continued for the small-cap index. I postulated in that article that the RUT could go down to the 1,010 area before seeing a support level. While that was what I wrote, I can’t say that I expected the RUT to get down to that level in a matter of weeks, I thought it would take a month or two at the very least. But when the index loses 4.65% in one week, it doesn’t take long to see a major decline.
Similar to the S&P, the RUT does have a potential support level in the form of a moving average, but with the RUT it is the 104-week moving average rather than the 52-week.
My lost thought is regarding the idea of using a market neutral strategy and using the sentiment to choose which stocks to buy long and which ones to sell short. I sat down on September 20 and 21, and calculated the sentiment composite readings for 10 stocks in each of the 10 major sectors that Standard & Poors identifies. To give you an idea of what that looked like, here are the rankings for the energy sector.
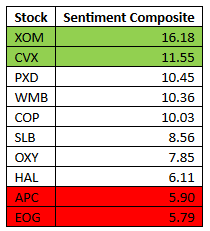
The idea was to buy the two least liked stocks, in this case Exxon Mobil and Chevron, and in turn sell the two most loved stocks, EOG Resources and Anadarko Petroleum.
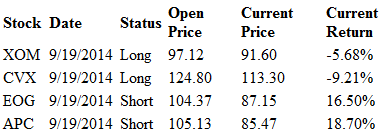
I can tell you that I started a model portfolio using this theory back on September 21 and I did this for all ten sectors, so the model portfolio has 20 stocks held long and 20 stocks sold short.
So how has it done in the last three weeks? As of last Friday’s close, the strategy was up 1.5% while the S&P was down 5.19% in the same period. How can that be? Let’s look at the results for the four stocks above. What we see is that yes the long positions did go down as the market has fallen. However, we see much steeper declines (gains on short sells) on the two stocks that were sold short.
Looking at the data over the weekend, I can tell you that of the ten sectors only one sector had a negative return. The other nine produced small gains and energy was one of the best performing sectors for the strategy.
If you think about the results, they make a lot of sense. If a stock isn’t very well liked, not as many investors are holding it, so it is less likely to see heavy selling pressure. When a stock is loved and widely held, more investors are holding it and therefore it is more susceptible to selling pressure.
I am anxious to see how the portfolio does going forward and I am particularly interested in seeing how it performs in a bullish period. The point of sharing this information isn’t to pat myself on the back, it is to point out to you that there are more ways to invest than the traditional buy-and-hold strategy.


