
 Two weeks ago on this website I told you that if markets turned up on that day, the bull market would be on. The market did turn up, and has been on a tear ever since.
Midas Legacy’s ‘Market Trend Alert’ also gave this market a ‘thumbs up’ two weeks ago too- check it out on our home page, it’s an excellent tool we offer you for free and that alone would’ve made you money recently. There’s no telling what happens next day to day, but as long as that thumb is up, this is a bull market.
The main thing I’m pleased about is that the possible head and shoulder pattern in the main indexes (a very reliable bearish omen) forming that I mentioned here in this column on 09/13 has been wiped out of the equation. Barring any unforeseen events, it should be clear blue skies for now.
But until just a few days ago, the talking heads in the mass media were still predicting a downturn. Now they’re quieter. If ever I want to assure myself that most experts, pundits, and professionals don’t really know what they’re doing, I find out which stocks have the largest short positions (bets on the price falling) against them, and then I check out the charts for those stocks, because it could be time to squeeze cash from the skeptics…
When there are too many people on one side of a trade (short or long) it can mean that things are about to swing the other way. When traders with short positions have their trade go against them (because the stock is rising), they have to bail out of it by buying the stock instead. This can cause a big surge up in the price of that stock. This surge is termed, a “short squeeze”.
On this occasion I discovered Nokia (NOK) and Intel (INTC) as two stocks that have the largest short positions against them.
Nokia now has huge amounts of bets on the price falling. This really should be the smart money doing this, but the chart tells me (as expected) that it’s actually the dumb money, in the medium term at least. Personally, I don’t know anyone who has a Nokia phone, but that doesn’t matter because this is not a chart that I would want to short:
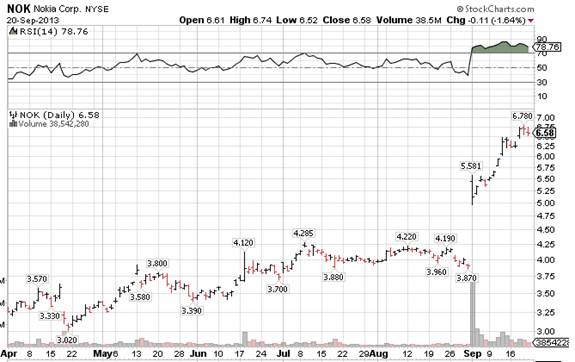 (source: Stockcharts.com)
In fact, that’s just the kind of chart I look to BUY into. That big black volume bar on the bottom right is showing that this stock is being accumulated, and it’s now in a steady upwards channel, consolidating around the $6.50 to $7 area. Anything can happen in the short term, of course, but this is a healthy, even exciting, chart. Someone on the inside knows something here, and if it can hold above $6.50 or at least $5, the shorts will get frustrated. If it breaks up above $7.50, they may get squeezed out of it and make the price soar.
Next up, Intel:
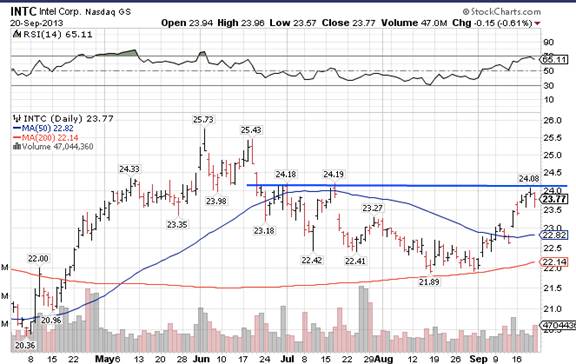 (source: Stockcharts.com)
Unlike with Nokia, I can’t think of a good reason to be short this stock. And the chart agrees. This is a healthy chart, trading above its 50-day and 200-day averages (the curved blue and red lines). I’ve also drawn the overhead resistance at around $24.50. If Intel can push above it the shorts should get squeezed here too, and the price will rise higher as a result. The only way I’d dream of shorting this stock would be below $22, and it’s nowhere near that yet.
Best,
Jim.


