
 So the S+P 500 marched to record highs this week, confirming our ongoing belief in this bull market until proven otherwise.
Today I’ll take a closer look at this to see if a pullback is looming and how to trade it, as well as a neat trick to time any market, especially one that’s bouncing around like this one…
Let’s take a look at the S+P:
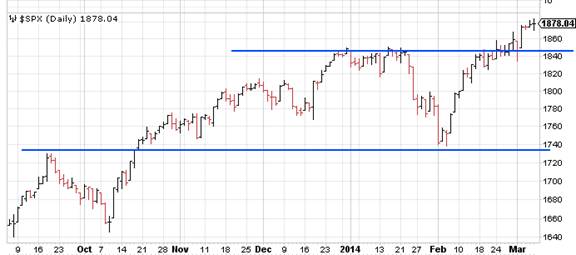
As everyone here at Midas Legacy has been saying (not to mention Midas Legacy’s market trend alert), this uptrend is intact, and the downturn that you can now see in February was simply a healthy correction in the steadily ascending staircase you see above.
But markets don’t go up in straight lines, and the zig-zagging can be frustrating, not to mention scary at times. So let me show you a market-timing tool that Adam Woods (of ‘Midas Wave’ fame) recently shared with me…
As I’ve mentioned before, the average price of the last 50 days (called the 50-day moving average or ’50 dma’) is a key short-term metric used by analysts. When a stock is above the 50 dma it’s considered bullish, and below it as bearish. Of course, this is a self-fulfilling prophecy, but if it works, who cares?
Anyway, something that follows this self-fulfilling prophecy is that when too many stocks are above their respective 50 dmas analysts consider the overall market overbought and due for a pullback. And vice versa, when too many stocks are below their 50 dmas, it’s considered oversold and due to bounce back.
It’s considered that when 70% of stocks are above their 50 dma that the market is getting overbought. And when 50% of stocks are above their 50 dma that the market is getting oversold.
In the chart below the percentage of stocks in the S+P 500 above their 50 dma is shown over time by the zig-zagging line. I’ve added the 50% and 70% lines so you can see the ‘neutral’ zone:

As you can see, the market is into temporarily overbought territory again. It’s by no means foolproof, but it does show a pattern that may help you time things and gauge which way the rubber band is stretched at any give time. Remember, your trades are sailboats that are subject to the prevailing winds that the market blows, and you want that wind in your sails.
Best,
Jim.


