
 It seems I was right to be suspicious about the correction being over. As I write this on the Friday before publication, the correction is very much still in force and the major indexes are teetering on the edge of an important level.
So let’s look at the big picture as well as look at one more warning sign about a change of ‘season’ in the markets…
Markets go through four distinct cycles that resemble the four seasons: summer being a bull market, and winter being a bear market. What comes in between are the transition seasons of spring and autumn. These cycles are as repetitive and predictable as the seasons themselves, there’s no mystery about it.
So, naturally, after enjoying a long summer (bull market) that started way back in 2009, we are now expecting and looking for the inevitable autumn season to transition us into the inevitable winter (bear market).
This ‘autumn’ season usually has choppy action with lots of selling and buying volume, the price of the market starts to sag closer to its long term price average, which in turn eventually flattens out, and the price bounces above and below it.
Regular readers know I watch the Russell stock index of small companies as a leading indicator, and we can see that’s been in an autumn phase (curving blue line is the benchmark long term price average):
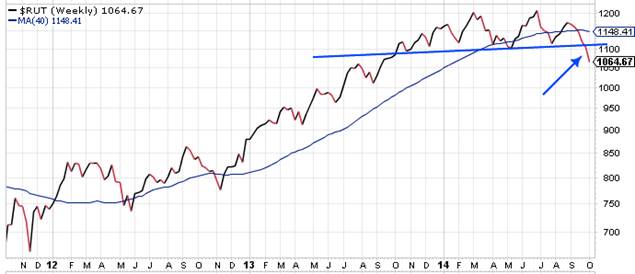
I’ve also drawn a straight line of support there for RUT, which as you can see has been breached as I write. This is a sick chart.
Turning to the benchmark index, the S+P, we can see that this correction is getting closer to its long term average than before. This will make that blue average price line flatten out as it eventually enters its autumn phase, but this chart isn’t badly damaged just yet.
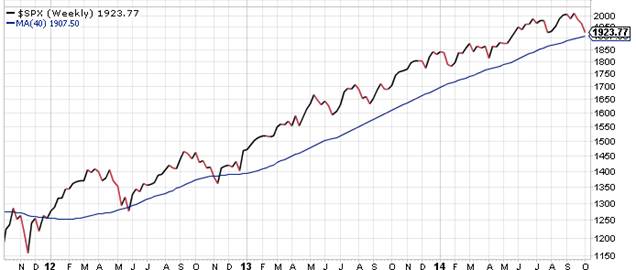
For now, the S+P must stay above the 1,900 mark to remain bullish. And if it can bounce back up the uptrend will go on a while longer.
Something else to use as a leading indicator of when these transitions take place is by studying the action of the stocks that led the bull market; when those stocks no longer lead the market and start to look sick, you know the bear is on the way.
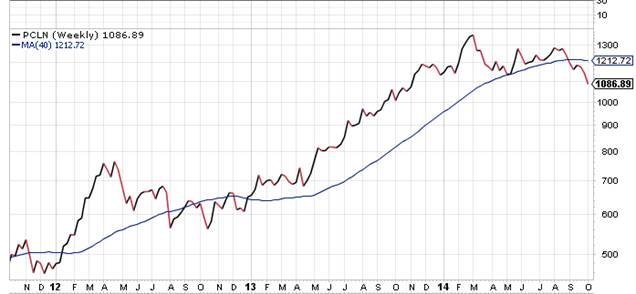
So what could that tell us? Well, it’s a bit of a mixed bag. For example, look at this sick chart of Priceline, a big bull market leader previously:
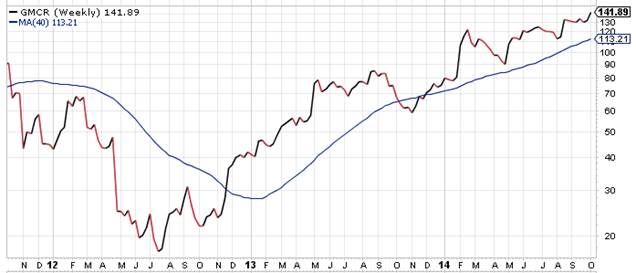
But then look at this very healthy chart of Green Mountain Coffee, another bull market leader:
Bottom line: The bear army isn’t here yet, even though on some days it may feel like it. But we are in sight of his scouts and skirmishers. Needless to say, we will be keeping you one step ahead so you know when the time is right to switch sides in the never-ending battle of buyers and sellers.
The author has an interest in the securities discussed in this article. Source of charts: stockcharts.com
Note from editor: check your email to see if you received a limited time invitation to Stock Code Breaker.


