
 While the media spotlight swings onto speculation about “Government Shutdown!” we turn, as always, to the facts and what we DO know, not what we DON’T. Whether this already ridiculously indebted government will take on even more debt or not is something I’ll deal with, as and when it happens.
For now, let’s look at an opportunity that is looming no matter what happens, though it’s certainly related: gold.
Recently the gold price and miners were trashed as fears over Syria subsided. Never mind that the Fed effectively said they would print money for as long as they could get away with it (which should be bullish for gold). And now we have the debt ceiling drama that will surely push gold higher whatever happens: government shutdown (which I strongly doubt) would cause lack of faith in the dollar which is bullish for gold, and increased debt is bad for the dollar which is bullish for gold!
So, just run out and buy gold then, right?
Not so fast. If the so-called experts who trade stock markets had any sense, yes, then gold should be flying now. But the market always does what’s it’s supposed to, but never WHEN…
I’d like to show you WHEN to buy gold, and if the scenario I’m about to show you does happen in the coming weeks, you should buy BIG. I mean, back up the truck time, because you could make a fortune from this single number…
Here’s why…
A perfect storm is brewing on this chart of GLD (a proxy for gold prices:
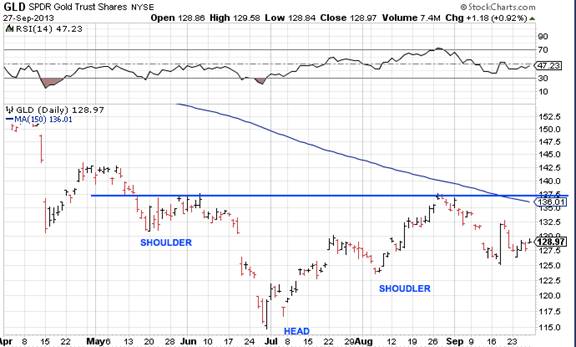
There’s 3 bullish storms here in one, if it happens:
1. An inverse head and shoulders pattern has formed (bullish). The horizontal neckline has been drawn there at $137.50. If GLD rises above $137.50 that’s bullish, but when the neckline is perfectly horizontal like that, even more so. This alone would be enough to get excited at that level, but there’s much more…
2. Neckline aside, that horizontal line is classic, well-established overhead resistance. If that breaks, it’s going higher.
3. Finally, one of my favorite (but not widely studied) trend lines that shows the average price of the past 150 days is at $136.01, very close to the $137 mark.
When three different treasure maps all point to the same place, you have to get your shovel ready.
So watch that price of $137.50 for GLD because we’re not far off at the current price of $128.97 (you can see the constantly updated price of GLD on our website home page). If it hits $138.50/$139, gold is off to the races. Set your alerts, mark your calendar, put a post-it on your fridge, whatever you need to do. That is, assuming this chart doesn’t change much in the coming days and weeks. In my monthly newsletter, Money Mentor, I’ll be showing subscribers the best way to trade this event as well as monitoring this closely.
Best,
Jim.


