
 Let’s Look At Quantitative Easing In The States
When the European Central Bank announced that it was launching a bond purchasing program on January 22, the world stock markets took off. Indices across the globe shot higher as the ECB entered its own version of Quantitative Easing, much like the one used by the U.S. Federal Reserve from 2008 through 2014.
Before investors celebrate too much and think this is the end of any possible recession in Europe, they should look at the recent QE1, QE2 and QE3 that the Fed implemented. Without looking at stats or a chart, most analysts would say that the QE program was successful. When the first round of stimulus was announced in the fourth quarter of 2008, the GDP Growth Rate in the U.S. was -8.2%. One year later, in the fourth quarter of 2009, the growth rate was at +3.9%. Most people would consider that a success.
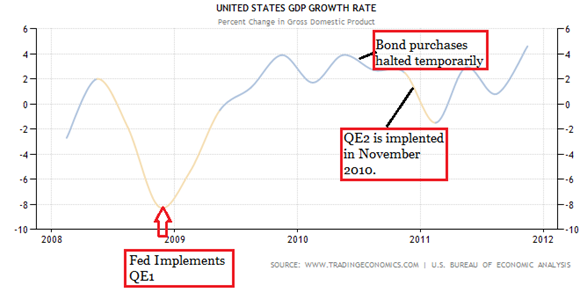
After a successful turnaround and with the GDP growth rate changing so drastically in one year, the growth stalled. From Q4 2009 to Q4 2010, the growth rate went sideways and ended up at 2.5% in Q4 2010. During the fourth quarter that year, the Fed announced a second round of quantitative easing (QE2). At the end of one year of QE2, the GDP growth rate was up to 4.6% in Q4 2011. Once again the stimulus was successful for a year.
Moving ahead to 2012, the economy was once again stalling. The growth rate dipped to 0.1% in Q4 2012, but that is when the Fed stepped in again and launched QE3 on September 13, 2012. Not quite during the fourth quarter, but close enough. Once again it was successful for about a year as the GDP growth rate hit 4.5% in Q3 2013 and came in at 3.5% in Q4.
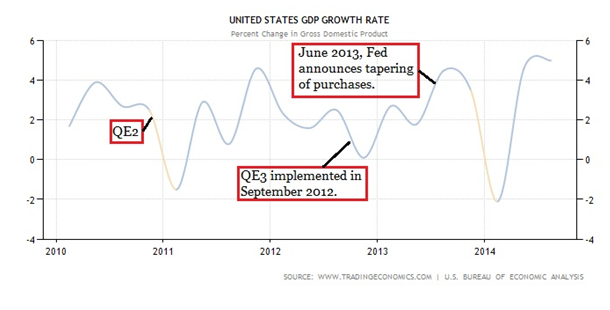
In June 2o13, the Fed announced a tapering off of some of its bond purchases. That did not go over well as the GDP growth rate dropped and for the first quarter of 2014, the growth rate fell to -2.1%.
So what can the ECB learn from all of this? First, each round of stimulus only seemed to be good for about a year. Secondly, they better be very tactical about how they taper their purchases as well as how they announce the tapering. Any surprises could strike fear in investors and send the stock markets tumbling.
Now that we see how the QE policies impacted the GDP growth rate, let’s look at the effects on the stock market. The chart below shows the S&P and how it did with each round of quantitative easing.
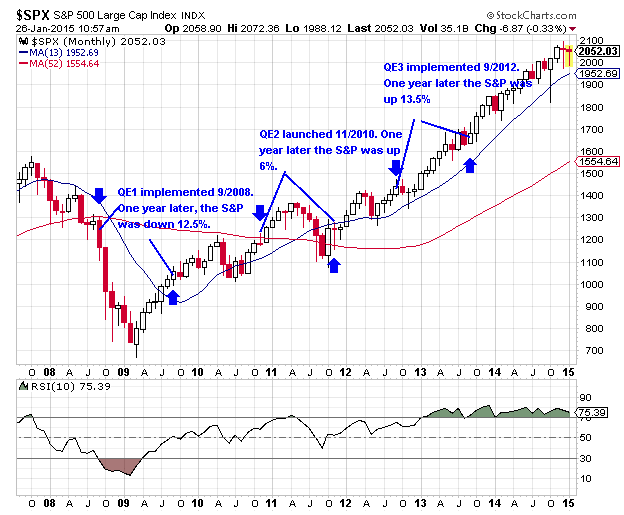
As you can see, the first round of QE didn’t help the market turnaround immediately as the index fell for another five months before the rebound started. The S&P was down 12.5% one year after QE1 was implemented. The second round had somewhat of a positive impact as the S&P was up 6% one year after QE2 was launched. QE3 had the greatest impact on the market with the S&P up 13.5% one year later.
It is hard to attribute all of the losses or the gains in the S&P to the quantitative easing policies, but you know they had an impact. Again, you have to remember that this was one country’s central bank focused on its own economy, not a central bank covering 19 countries with 19 economies.
While the various rounds of quantitative easing in the U.S. were successful to some degree, the benefits seemed to be limited to about one year on the GDP growth rate. The impact on the equities market is a little harder to quantify and they weren’t as successful.
The bottom line is that there are hurdles for the European QE package faces that we didn’t see here in the states. Personally I don’t think this package will be as successful as the ones used in the States.


