
 You have to hand it to Manchester United fans that aren’t from Manchester- they focus on the team most likely to win, and thus increase their chances of winning. Nothing against Manchester United fans, no hate-mail please!
As we’ve hammered over and over, the first step is to be in synch with the overall market, but there’s an additional refinement you could add here. I say, “could” because it’s not mandatory like being in synch with the market, but it can help you a great deal…
The overall market is divided into industry groups, and these groups tend to fall in and out of favor with the big-money players who move markets.
So it’s logical to believe that picking a stock in the best performing industry groups increases your chances.
It’s not just logical, it’s a well-proven fact…
A comprehensive study undertaken from 1963 to present day found that the industry groups that were the highest performers for the previous six months outperformed the market.
Some people (cynically) refer to this as “momentum investing”. Call it what you want, but if it makes money, call it “Bob” for all I care!
You could find a beautiful trade, in synch with the overall market, but it may not perform as well as it should if it’s in an industry group that’s being trashed. So here are the groups to be aware of (I’ll tell you what the code next to each means in just a second):
- Basic materials (XLB)
- Industrial/Capital goods (XLI)
- Consumer cyclical (XLY)
- Consumer non-cyclical (XLP)
- Energy (XLE)
- Financial (XLF)
- Healthcare (XLV)
- Services (XSW)
- Technology (XLK)
- Transportation (XTN)
- Utilities (XLU)
- Retail (XRT)
And, handily, you can see how each of these groups are doing by looking at a weekly chart, the same as you would do for any stock! Each group has an “ETF” (Exchange Traded Fund) which is an investment fund like a basket of stocks from that group. It has a stock ticker and can be traded like any other stock, which I’ve added to the list above.
For example, here’s a weekly chart of XLF, the financial group of stocks…

And here’s the chart of the utility industry group, XLU:
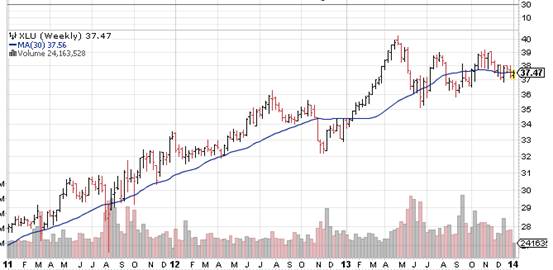
XLF appears to be in favor, and XLU looks like it’s slowly falling out of favor.
It’s not crucial, BUT if you can choose a stock that’s in synch with the market as well as the industry group it’s in, well, your odds of a winner have shot up.
Best,
Jim.


