
 As I explained last time, we had to put this bull market on pause as it broke its upwards trend. Since then the market has bounced back violently and gold has broken down.
So is the bull rampaging again? Or is it the bear trying to sucker you in? Let’s try to find out…
I’m often critical of Wall Street axioms because so many of them are nonsense, but there are a few little-known ones used by the better players that I do try to bear in mind. Here’s one I’m reminded of at this time:
The bull will try to take as few people as possible up with him. He does this with steep downward corrections along the way, to shake off the weak money.
The bear will try to take as many people as possible down with him. He does this with steep upward corrections along the way, to suck in the weak money.
So is this violent bounce the real deal or is it what’s known as a ‘sucker’s rally’?
The first thing to remember is that, as I said last time, this is not a bear market- yet. So for that reason alone it’s hard to put this down to one of the bear’s tricks. Let’s take a look at the benchmark S+P 500:
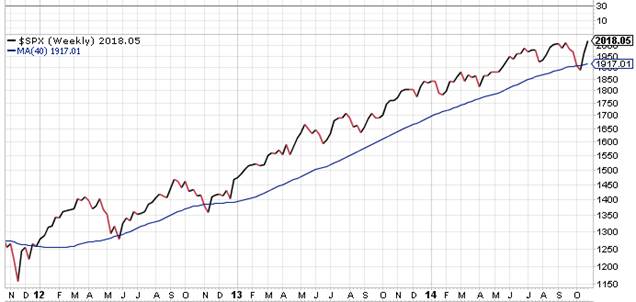
Take a look back at those drops in May of 2012 and November 2012. It’s certainly not impossible that the market can dip below the long term average price (blue line) like it did recently and then continue higher as it clearly did back then in 2012. When prices pushed higher after those dips in 2012 the market surpassed the previous peak in prices, as you can see. The dip below the long term average was brief, and the average line continued pointing upwards.
What’s significant about this recent bounce is that both major indexes- the S+P and the Dow Industrials both closed at all time highs last Friday, and that should point to the bull being back in power for now. One could argue that the recent break in the long upward trend was a false anomaly, but I’m cautious to find excuses and second guess what the market is telling us, so I say that the bull is back in control very cautiously and with one hand ready to trigger the ejector seat if things go bad again.
If the S+P and the Dow both fall below that long term (200-day) price average line again within the next few months all bets are, quite literally, off. But failing that, upwards seems to be the path of least resistance for now, and prices, like water, follow the path of least resistance. Also consider that 2,000 is a big psychological victory for the S+P and we’re heading into what are usually strong months for the market: November and December.
Meanwhile, though I gave gold the benefit of the doubt for a while, it has finally broken support. Weeks ago I explained that if gold (through the GLD ETF) broke below $115 that lower prices would likely follow.
One nagging doubt still sits with me though as I give the keys back to the bull. Utilities are being snapped up still- that’s the strongest group by a long way currently, and utility stocks are defensive by their nature. Why are the big banks buying safe and defensive utilities if there’s no bear in sight…?
The author has an interest in the securities discussed in this article. Source of charts: stockcharts.com
Note from editor: check your email to see if you received a limited time invitation to Stock Code Breaker.


