
 Well, here comes that healthy correction I’ve been waiting for, and a well overdue one at that. Meanwhile the mainstream media start screaming about crashes again. I’ve lost count of the times that I’ve commented in this column on such healthy corrections being nothing more than that within an ongoing bull market.
Of course, if you scream ‘crash’ often enough and long enough, you’re eventually going to be proven right, and you will steal undue credit for doing so as well as missing out on a lot of profit. But let’s see if those screamers are going to be proven right this time…
As always, when I want to cut through all the noise and nonsense I simply let the market tell me its story. Let’s take a look at the long-term chart of the S+P 500:
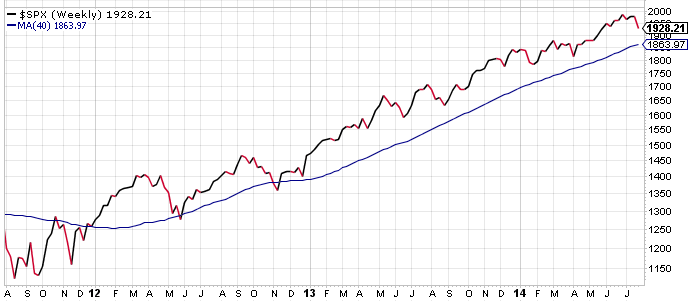
The uptrend is still intact from what any sane person can see. In fact, you might argue that this correction is just one in a string of opportunities to ‘buy on the dips’. That blue line I drew there is a key long term moving average price, and all the time that’s pointing upwards and the price of the S+P is above it, all is well.
But that’s more than I can say for another index which represents smaller companies, which many argue is a clearer reading of what’s going on in the real economy. Here’s the Russell 2000:
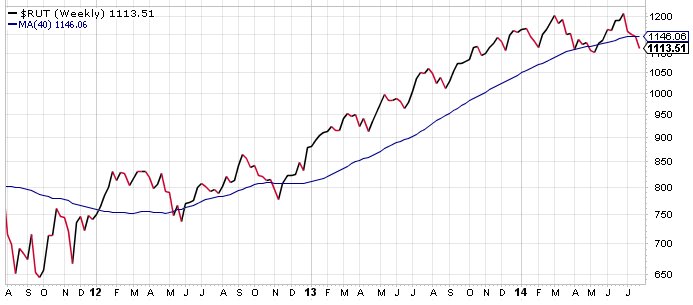
The above chart, while not bearish, appears to be entering a transition phase. Notice how the long term moving average is flattening? And how the price is below it? If the Russell 2000 is a leading indicator, a ‘canary in the coalmine’, then it’s saying the next bear market isn’t far ahead.
Another chart- something I mentioned last time- is of the homebuilders index, a representation of how the all-important housing market is doing. Here’s an update on XHB:
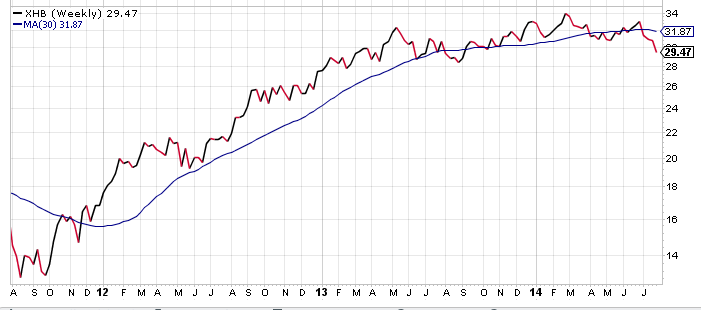
I don’t like how this chart has flattened, and I don’t like how the price is trending down. This too is another omen of a phantom menace possibly developing under the surface.
Having said all this, we’re not there yet. All the time that the major indexes such as the S+P 500 and the Dow Industrials are saying, “bull”, I’m a bull too. But let this correction play out- it’s okay to be a long term bull but a short term bear. And that’s precisely what The Midas Legacy market alert indicators are saying currently.
Best,
Jim
The author has an interest in the securities discussed in this article. Source of charts: stockcharts.com
Note from editor: check your email to see if you received a limited time invitation to Stock Code Breaker.


