
 At first glance, the average investor might think the main driver behind increased hydrocarbon production from unconventional shale deposits would simply be more wells in production. But that’s not the biggest factor.
It turns out the productivity of horizontal oil and natural gas wells are steadily increasing. It all has to do with the increasing efficiency and precision of hydraulic fracturing and horizontal drilling.
Take a look at the graphic below, courtesy of the Energy Information Administration (EIA).
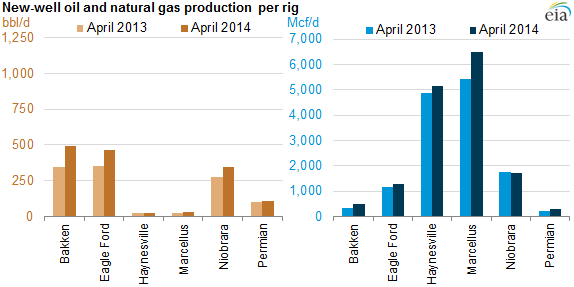
In almost all cases, the productivity from new wells is higher this year than it was in 2013. Right now, the Marcellus Shale is leading in increased production of natural gas per rig. The Eagle Ford Shale is the leading play in increased production of crude per rig.
The graph below, also courtesy of the EIA, shows the increase in production for the six major shale plays since January 2007.
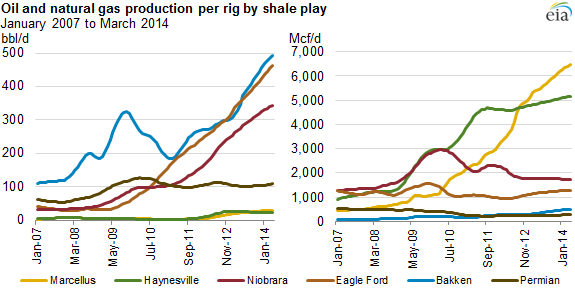
Both Bakken and Eagle Ford wells drilled in April 2014 will contribute about 400 barrels of oil per day (bbl/d) more than those drilled in 2007. Marcellus Shale gas wells drilled in April 2014 should yield more than 6 million cubic feet per day (MMcf/d) more than those drilled in 2007.
The important thing to note here is that technology marches on. Increased accuracy of seismic data on each play’s geology helps drillers direct their well bores more precisely.
Drillers are also drilling longer laterals. Back in 2007, a long lateral might have been a few thousand feet. Now, laterals are reaching 10,000 feet in some cases.
The number of frack stages has gone from less than five back in 2007 to over 30 on some wells now. It all adds up to much higher production rates per well. Combine higher production rates with lower well drilling and completion costs and E&P companies are continually lowering their production costs.
Higher Production Equals Lower Imports
The United States rapid rise as both a crude oil and natural gas producer from shale deposits has had a remarkable effect on energy imports. Check out the chart below from the EIA.
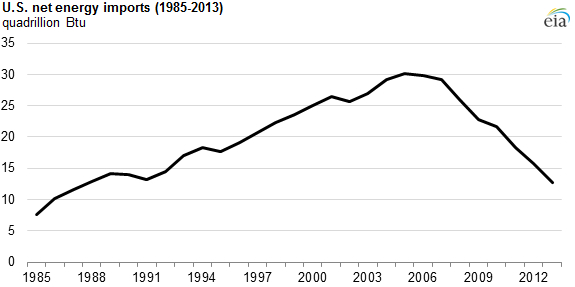
Incredibly, the net imports of U.S. energy are now the lowest they’ve been in more than 20 years. Horizontal drilling and fracking have increased supply.
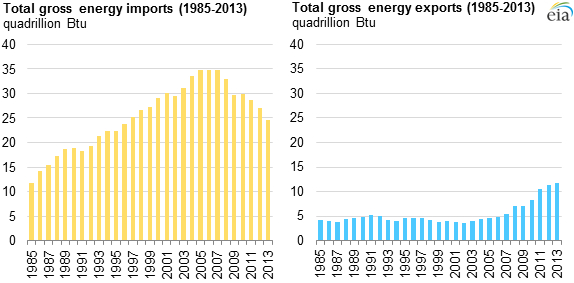
In addition, the U.S. has increased its export of petroleum products, such as diesel fuel and gasoline. From 2012 to 2013, net energy imports decreased 19%.
Right now, energy imports are declining at nearly twice the rate that we were once importing it. If that continues, we’ll reach self-sufficiency sooner than most experts are predicting. Trade surplus, anyone?
As you can see from EIA’s data, energy imports peaked from 2005-2007, and have been in rapid decline ever since. Energy imports declined 9% from 2012 to 2013, much faster than the year before.
In 2013, crude oil production grew 15%, about the same rate as in 2012. That meant imports of crude oil decreased as well. It was down by 12% in 2013.
On the export side, finished petroleum products have been on the rise since 2002. It’s currently illegal to export crude oil from the U.S., but finished products are sold to both European and Latin American customers.
It’s obvious that the prolific production of energy in the United States is having a positive effect on our balance of trade. We may yet live to see the day when the U.S. once again generates a trade surplus.
In my Wealth from Power newsletter, we’re capitalizing on our newfound energy surplus here in the U.S.
How are we doing? We’re five for five. That’s right, we have five stocks in our Wealth from Power portfolio and they’re all profitable. Three of them have double-digit gains.
Several of our open options positions have gains over 200%. We just added a sixth stock to our portfolio this week. To find out how you can get in on the profits, check today’s newsletter email to see if you received your exclusive invitation.
Profitably Yours,
Peter Fallon


