
 You don’t need experience, a special education, or even to have ever tried investing before. Trading in the stock market doesn’t have to be as complicated as many people try to make it out to be.
One of the best ways to simplify it and profit is to identify reoccurring patterns, one of which is forming right now…
Please let me show you why this is one of my absolute favorite patterns. Your potential payouts will make it very much worth your while.
What are some of the basics that virtually everyone knows about the stock market as a whole?
It goes up and down. It’s where stocks are traded. It’s made up of everyone’s investments in companies and other securities.
In all honesty, you don’t need to know a whole lot more than that in order to become successful with your trades and investments. And I’m not just talking about the miniscule success that mutual fund managers offer (their 5% growth rate or whatever it is these days is dreadful).
I’m talking about making significant gains on your capital—the kind of gains that could end up getting you to retirement years before you thought it was possible.
But how?
Like I said a moment ago, if you can identify certain patterns that happen again and again, you should be able to find easy success in the stock market.
Right now I want to show you a specific pattern for two reasons:
1. It’s one of my favorites.
2. It’s happening right now.
This pattern is what I call a slingshot. To explain, take a look at the chart for the benchmark S&P 500 (SPX), which serves as a representation of the overall market:
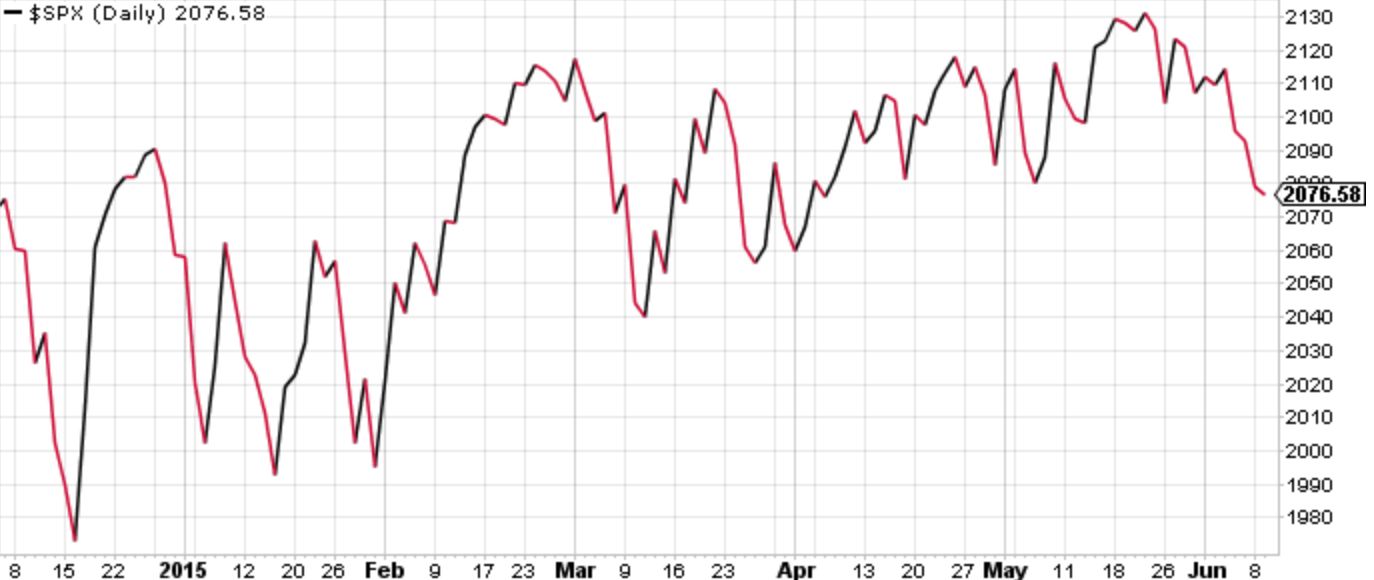 (From Stockcharts.com)
What do you see?
An overriding uptrend with a bunch of up and down movement in between. It looks kind of hectic doesn’t it?
Now let’s add in the secret to identifying the slingshot pattern…
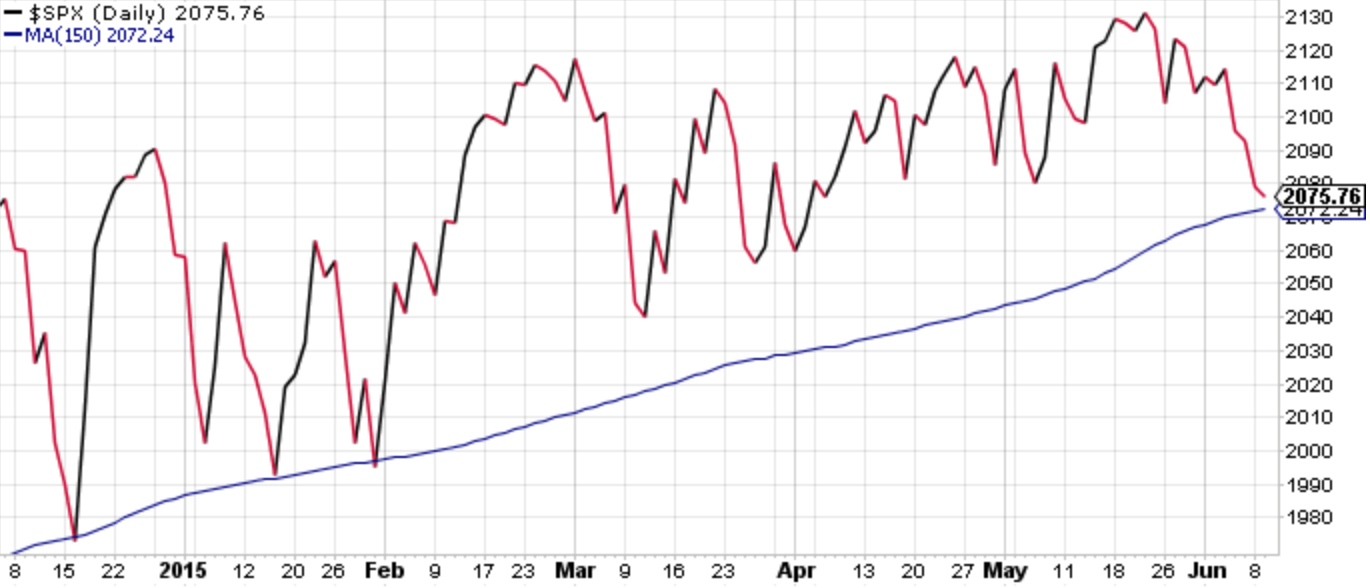
Here is the exact same chart but with the long-term moving average added to it as that blue line.
Now look back at the beginning of the chart. See how on 3 separate occasions the SPX fell down to that blue line, touched it, then bounced right off? And those bounces are normally significant.
It’s like a slingshot being pulled back as the price falls toward the blue line until it finally reaches it, and then the slingshot is released and the price shoots upward.
Now check out the far right side of the chart where it’s happening again.
The slingshot is loaded and pulled back, nearly touching the blue line.
And profiting from when the slingshot fires off is easy. As the market rises, so does the majority of securities traded on Wall Street.
The slingshot is just 1 pattern of the stock market, and there are several more that could all make you easy money. For access to those patterns, as well as the best strategies for investing we have to offer, check out Code Breaker.


