
 It wasn’t that long ago when Saudi Arabia and the other members of the Organization of Petroleum Exporting Countries (OPEC) held the U.S. hostage over oil. Not anymore.
We’ve gone from groveling – at least when it comes to oil – to thumbing our noses at them. It all changed in less than a decade.
At the end of 2013, the U.S. will hold the title of the world’s largest hydrocarbon producer. It all has to do with America’s huge lead in hydraulic fracturing and horizontal drilling.
I’m going to show you a great way to play the U.S. hydrocarbon “U-turn.” Let’s first look at some of the jaw-dropping statistics.
Take a look at the chart below, courtesy of the International Energy Agency (IEA) and Bank of America Merrill Lynch Global Commodities Research. It depicts the global supply growth of crude oil in thousands of barrels per day, year-over-year, for 2012.
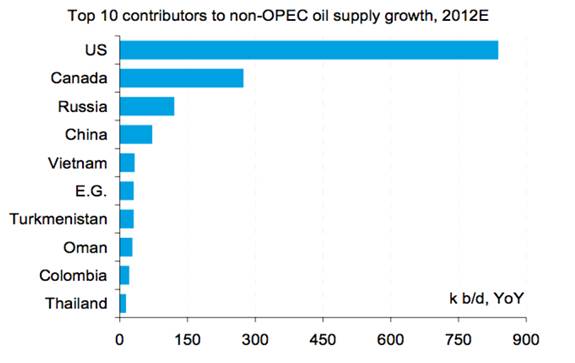
To say that U.S. supply growth in 2012 has outpaced every other country is putting it mildly. We’re growing nearly three times faster than Canada and more than six times faster than Russia.
Based on our continued growth in supply, and the rate of that growth, it’s no wonder U.S. energy output is reducing the clout of OPEC and other energy-rich countries. It’s a scenario that would have been unthinkable ten years ago.
America’s resurgence as a new energy superpower comes at a time when Russia is struggling to maintain its energy production. Both it and China have yet to embrace fracking and horizontal drilling. The main reason is access to Western technology.
Saudi ‘America’
Adam Sieminski, head of the Energy Information Administration (EIA) commented on the U-turn in U.S. energy production. “This is a remarkable turn of events. This is a new era of thinking about market conditions, and opportunities created by these conditions, that you wouldn’t in a million years have dreamed about.”
According to EIA figures, the U.S. produced 22 million barrels of oil equivalent per day (Mmboe/d) this past July. Moscow’s forecast for Russia for 2013 works out to 21.8 Mmboe/d. These figures include both oil and natural gas production.
U.S. net imports of crude oil and petroleum products peaked just over 60% in 2005. It’s been on a steep decline ever since.
Right now, net imports account for 40% of petroleum, diesel fuel and other hydrocarbon liquids we use. On the import side, natural gas and crude have fallen 32% and 15% respectively over the last five years.
The good news is over 50% of those imports come from countries in the Western Hemisphere. Here’s a list of the top five sources of imported crude oil and other petroleum products:
- Canada (28%)
- Saudi Arabia (13%)
- Mexico (10%)
- Venezuela (9%)
- Russia (5%)
So, what else is figuring into the U.S. being coined Saudi ‘America’? Since the U.S. consumes nearly 25% of the world’s total energy, growth in U.S. supply has left substantial supplies for other customers.
Countries like Russia derive a substantial part of their economic gains from the sale of hydrocarbons. Now, they face lower prices as U.S. supplies continue to rise.
OPEC will try to cut back supplies in order to keep prices firm. However, its members generally cheat anyway so its anyone’s guess how much effect that will have on Brent Crude.
Now let’s talk about natural gas. For the first time since 1982, the U.S. produced more natural gas than Russia last year according to data from the IEA.
We have so much here that we’re building LNG export terminals to be able to market some of that excess to customers around the globe. That will slow Russia’s gas exports even more.
They’ve already slowed from rising competition elsewhere and the current economic slowdown in Europe. In an article in the Wall Street Journal, Tatiana Mitrova of the Russian Academy of Sciences’ Energy Research Institute had this to say about Russia’s global energy position: “Russia looks like the main loser in the global market.”
She’s not just whistling Dixie, either. Over 40% of the Russian budget comes from duties and taxes on oil and gas companies, according to Mitrova. She’s forecasting “that Russian oil exports could fall 25% to 30% after 2015, reducing gross domestic product more than $100 billion.”
On the plus side for Russia long-term, it has one of the largest, oil shale formations in the world. It is however still untapped.
The Best Way to Play the U.S. Oil and Gas U-Turn
In the California gold rush of the 1800s, the men who made the real money weren’t the miners themselves. Sure some of them struck it rich, but it was the companies that made and sold picks and shovels that really cleaned up.
It’s not so different in the oil and gas industry. Every well needs drill pipe. In the case of horizontal wells, we’re talking about miles of pipe per well. Then there’s all the other equipment like drill rigs, valves and thousands of other specialized parts.
One of the biggest suppliers in the business is National-Oilwell Varco, Inc. (NYSE:NOV). It produces all the components mentioned above to the upstream oil and gas industry.
The company operates via three segments: Rig Technology, Petroleum Services & Supplies and Distribution & Transmission. It’s currently in the process of spinning off the Distribution & Transmission segment into a separate public company.
Back at the end of October, National Oilwell reported its Q3 2013 results. Total revenues were $5.6 billion, up from $5.3 billion from the same period last year.
Net income was $636 million, compared with $609 million from Q3 2012. The company beat analysts’ expectations on earnings and revenues.
The stock is currently trading a few percent off its 52-week high. Lower oil and gas prices are the reason why. Savvy investors could use this as a great time to add one of the best oil and gas equipment suppliers to their energy portfolio.
Profitably yours,
Peter Fallon.


