
 As a market analyst, I am always looking for patterns that repeat. It doesn’t matter to me whether the pattern is in the chart, the calendar, the fundamentals or the sentiment. If there is a pattern that repeats and it will make for a sound investment, I am going to pay attention to it.
A number of years ago I was asked to speak to my oldest son’s fourth grade class and explain what I did for a living. I tried not to get too technical and tried not to bore them. I even used the old kindergarten exercise of drawing a circle, square and triangle on the board and then repeated the sequence. I asked the class what came next and of course they answered circle and they did it with a bit of a scowl on their face. They were trying to tell me they were well beyond that exercise.
After putting through that exercise, I took some stock charts I had printed off and did before and after print outs. I showed the chart as the pattern was developing and asked if they could see it and then asked whether they thought the stock went up or down after that. I then showed them what happened after the pattern. Either this was an exceptional class, or fourth graders are better at spotting patterns than a lot of adults as the class got them all right.
I think as adults we sometimes try to make things more complicated than they need to be and as a result we miss some good opportunities just by observing the simple patterns.
I have gone through all of this as a setup to point out a pattern that I noticed over the weekend. The pattern wasn’t on the price chart, but rather it was in the Commitment of Traders report for silver. I noticed that the large speculator group has lightened up on their bullish positions for 11 straight weeks. With that in mind, I started looking at past instances to see if there was any other period where such a streak had occurred. I found one in 2008 and when I found it is when my pattern recognition skills kicked in.
I have included a chart of each of the time periods below.
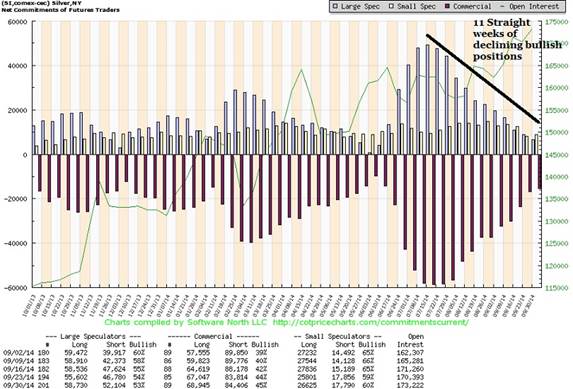
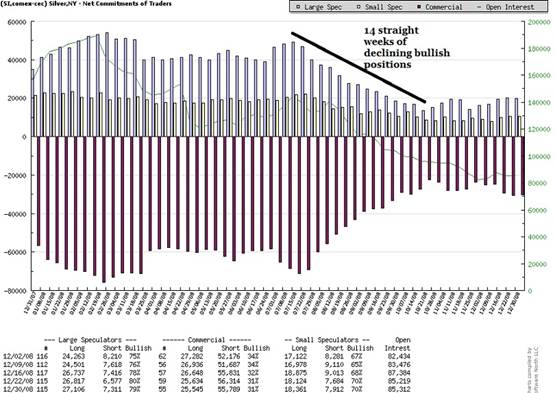
Obviously the first thing that stood out was the 14 week stretch of declines. The second thing I noticed was when the streak in 2008 started. I know the charts might be hard to read, but do you see the common trait in each chart? That’s right, both streaks started on the week of July 15 of that year. If the pattern holds true, we should see another three weeks of declines in the bullish positions and that would take us out to the week of October 21.
The third thing I noticed was the number of contracts large speculators were net long at the peak. On July 15, 2008, the group was net long approximately 50,000 contracts. On July 15, 2014, the group was net long approximately 50,000 contracts.
All of these similarities are fascinating and all, but the real reason we want to notice patterns is to make money from them. We see on the price chart that silver hit a low of $8.40 an ounce in October 2008. Two and a half years later, silver hit a high of $49.82 per ounce in April 2011.
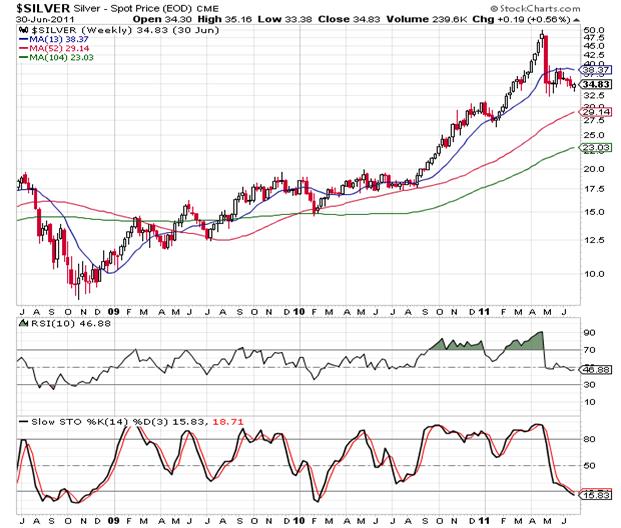
In the two-year bullish run, the price of silver increased nearly six-fold. If the pattern plays out the same and the multiplication factors work out the same, silver would rally to almost $100 an ounce. I am not saying that this is what will happen, but a triple in two years like we saw from 2008 to 2010 would make silver investors very happy, including me.


